Phylogenies and inter-sample comparison
Our previous discussion focused on the outputs that are produced for every
sample by Bactopia’s snippy workflow. After mapping reads to the reference
and calling variants, this workflow combines all the per-sample results
(using snippy-core), filters out variants from likely recombinant regions
of the genome (using gubbins) and produces a phylogeny (using iq-tree).
All of these outputs are collected in the bactopia-runs directory of
our output folder. This folder contains a subdirectory for every time
that the workflow has been run, for example, snippy-20240314-110200.
Keep track of when you ran your workflow to know which is the correct output
directory or look for a file called core-snp-clean.full.aln.gz using:
find bactopia_snippy -name core-snp-clean.full.aln.gz
The directory containing the core-snp-clean.full.aln.gz file should contain
all other output from the snippy workflow. The directory has subdirectories:
-
nf-reports: the Nextflow reports on workflow steps and resource consumption. -
snippy-core: the VCFs and FASTA files computed bysnippy-core. This include acore-snp.aln.gzfile that represents the core SNPs in FASTA format. Note that this will only include SNPs, not indels. -
snpdists: output of thesnp-distsprogram which computes a distance matrix that counts the number of SNPs that are different between each pair of samples (including the samples and the reference). -
gubbins: output of thegubbinsprogram that detects and filters likely recombinant regions in the genome -
iqtree: output of theiq-treephylogeny program including its log and the final maximum likelihood phylogenetic tree computed from the samples and reference.
The snippy-core program
The snippy-core program gathers together the SAMPLENAME.aligned.fa.gz files
produced by snippy. These files, according to the snippy web page
contain, at each genomic position, either:
-
a nucleotide copied from the reference (i.e. A, C, T or G)
-
a
-if there are no reads covering this position -
a
Nif there are reads but not enough to meet thesnippyminimum coverage parameter (the--mincovparameter to the Bactopia workflow).
Into this sequence are inserted the single nucleotide variants from the per-sample variant
calling step, filtering out any variants where any of the samples contains a - or a -N.
The implications of this filtering are important to understand:
Low quality data or reads that don’t map against the reference genome (perhaps because
they are contaminants) will result in large stretches of N or - in the genome. These
will, in turn, mask out any variants in the associated genomic regions. In the worst
case this causes snippy-core to crash with the errorr message:
Warning: No SNPs were detected so there is nothing to output.
ERROR: Could not run: snp-sites -c -o core-snp.aln core-snp.full.aln
The gubbins program
Gubbins identifies likely recombination sites by looking for areas of high densities of SNPs. This method assumes a relatively uniform distribution of mutations across the genome, which is a reasonable assumption to make for most bacteria. The Gubbins paper is worth reading to understand the approach, its strengths and weaknesses.
The SNP distance matrix
The snp-sites program computes a SNP distance matrix. This diplays the pairwise count of point
differences between samples (and the reference). This output is in in the
bactopia_snippy/bactopia-runs/snippy-YYYYMMDD-HHMMSS/snpdists/core-snp.distance.tsv file.
R can be used to visualise this distance using a heatmap. This code, reading
from the above-mentioend core-snp.distance.tsv file, is an example of how to draw such
a heatmap:
library(pacman)
pacman::p_load(rio,
               tidyverse,
               pheatmap)

snpdists = import('core-snp.distance.tsv') %>%
  column_to_rownames("snp-dists 0.8.2")
pheatmap(snpdists, display_numbers = TRUE)

The Phylogeny outputs from IQ-TREE
Finally, the IQ-TREE software is used to compute a maximum likelihood phylogenetic
tree from alignment produced by snippy-core and filtered by gubbins. There are several files in the
bactopia_snippy/bactopia-runs/snippy-YYYYMMDD-HHMMSS/iqtree folder, two of the most important being:
-
core-snp.iqtree: the log from IQ-TREE which shows how a model is selected and the tree constructed. This file includes a visual depiction of the tree, both in its draft stage and the final tree after Ultrafast bootstrap calculation. This bootstrap calculation assigns a score to each split in the tree that describes how strong the support is for the split. -
core-snp.contree: the consensus tree produced using multiple likelihood and bootstrapping. This file is in Newick format.
The Newick format core-snp.contree file is suitable for use in downstream visualisation software such
as Figtree, the Nextstrain project’s Auspice.us
and Microreact.
Before use in these tools, the core-snp.contree file should be renamed to core-snp.nwk.
Visualising with Microreact
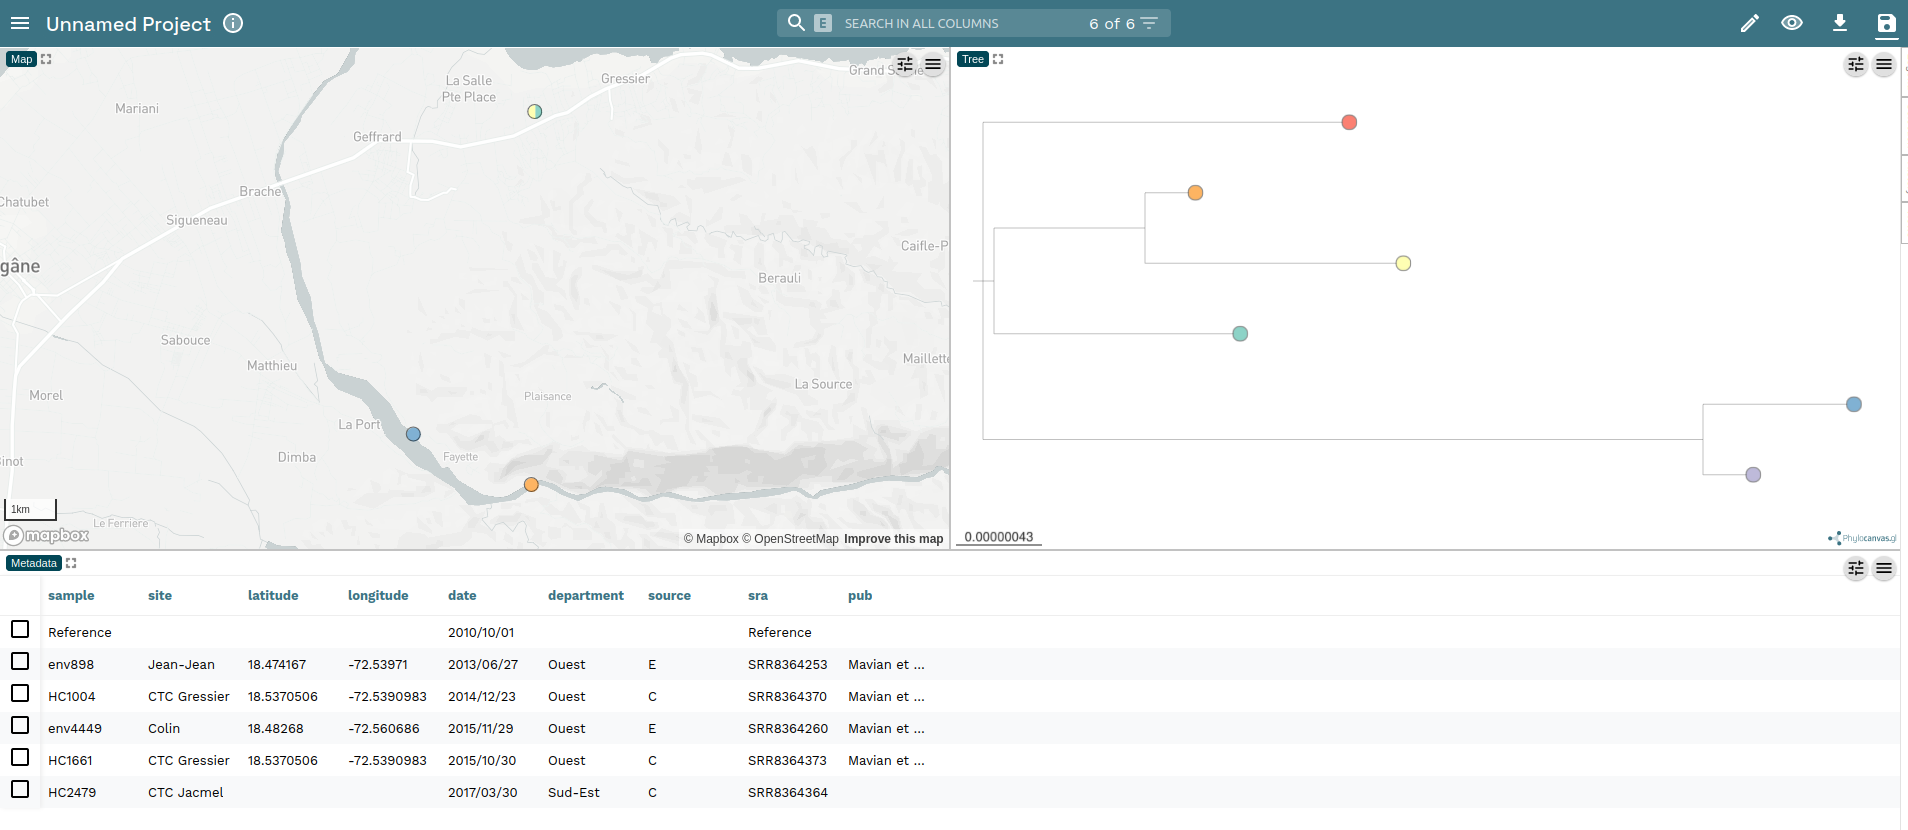
Microreact allows upload of tree files and supporting metadata.
A sample metadata file is here:
sample,site,latitude,longitude,date,department,source,sra,pub
Reference,,,,2010/10/01,,,Reference,
env898,Jean-Jean,18.474167,-72.53971,2013/06/27,Ouest,E,SRR8364253,Mavian et al 2020
HC1004,CTC Gressier,18.5370506,-72.5390983,2014/12/23,Ouest,C,SRR8364370,Mavian et al 2020
env4449,Colin,18.48268,-72.560686,2015/11/29,Ouest,E,SRR8364260,Mavian et al 2020
HC1661,CTC Gressier,18.5370506,-72.5390983,2015/10/30,Ouest,C,SRR8364373,Mavian et al 2020
HC2479,CTC Jacmel,,,2017/03/30,Sud-Est,C,SRR8364364,
This can be downloaded using wget or curl from https://gist.githubusercontent.com/pvanheus/8bcc5d8ffddead807dc769025f2d9ead/raw/6f20a7ab0fd2d693587ea5fa6578783c343826c0/metadata.csv
Upload the core-snp.nwk and the metadata.csv to Microreact ensuring that the tree is uploaded before the metadata file.
Then click Continue. At the next page select sra as the ID and the Label column, clicking Continue after each choice.
You will be presented with a view of both the phylogenetic tree and also a map showing where (most of) the samples were collected.

Read the Microreact documentation to learn more about what can be done with this web interface.
Fetching consensus sequences for further analysis
The consensus sequences generated by the snippy workflow are present in the per-sample directories, but are not named
to follow their sample names. The following script (gather_consensi.sh) will fetch these consensis into a directory
named gathered and change their FASTA header lines appropriately.
#!/bin/bash

if [[ ! -d gathered ]] ; then
	mkdir gathered
fi

for FILENAME in $(ls bactopia_snippy/SRR*/tools/snippy/N*/*.consensus.fa.gz) ; do
	echo $filename
	SAMPLE=$(basename ${FILENAME%%.consensus.fa.gz})
	zcat $FILENAME | sed "/^>/s/>.*/>$SAMPLE/" >gathered/$SAMPLE.fasta
done
This script can be downloaded at this link: https://gist.githubusercontent.com/pvanheus/7c838fbfe5bb524bdd4fba07d10ee685/raw/81075d7baccb6deed898c1cbfeb5aa3ae1d5d28a/gather_consensi.sh
After download, make it executable and execute it.
chmod a+x gather_consensi.sh
./gather_consensi
These consensus sequences can be analysed by tools such as Pathogen Watch or VicPred. The VicPred tool is specifically designed to analyse V. cholerae sequences and the associated publication by Lee et al is a good discussion of the diversity of the V. cholerae species and some of the genomic features of 7th pandemic V. cholerae El Tor.